FRAX
Frax is a novel type of decentralized stablecoin that aims to optimize capital efficiency and stability through a hybrid model that combines algorithmic and collateralized components. In order to do so, the protocol uses a swap-based model for its stablecoin design where Frax can be seen as a LP share over a pool of collateral (currently USDC) and algorithmic tokens (FXS).
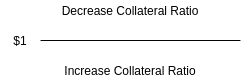
The protocol’s collateral ratio is dynamically adjusted based on Frax’s price. During periods of expansion (peg above $1) the collateral ratio decreases and during periods of retraction (peg below $1) the collateral ratio increases thus restoring the market’s confidence in Frax’s peg. Due to this dynamic, Frax lets the market decide its collateralization ratio without making any assumptions about it.
At any given moment, Frax can be redeemed or minted for $1 worth of collateral and FXS at the protocol’s current collateral ratio. For this reason, arbitrage opportunities arise when Frax deviates its current price from the dollar peg. These opportunities represent one of Frax’s mechanisms to maintain its price stability.
As of now, the protocol uses a two token model where Frax serves the purpose of a stable unit of account and FXS captures the protocol’s value and governance. Frax Finance is currently deployed on multiple Layer 1’s such as Ethereum, Binance Smart Chain, and Avalanche. Additionally, the protocol is also deployed on Matic (Layer 2 solution).
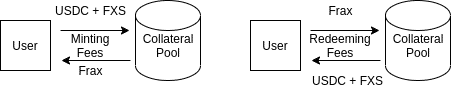
Minting and Redeeming Frax
Frax can always be minted and redeemed for $1 worth of collateral and FXS. In order to mint Frax, it is necessary to deposit the appropriate ratio of collateral and to burn FXS. On the other hand, while redeeming Frax the redeemer is credited with the appropriate ratio of collateral and FXS.
It is trivial to conclude that increasing demand for Frax represents a positive catalyst for FXS’s price through its token burn. The underlying value within Frax’s success and adoption are therefore captured through FXS. Both minting and redeeming operations have fees that generate revenue for the protocol. As of now, minting fees are set at 0.2% and redeeming fees are set at 0.3%.
Collateral Ratio
The collateral ratio (CR) is the protocol’s ratio of liability over its capital, this concept is analogous to a central bank’s balance sheet. Frax dynamically adjusts its collateral ratio according to the market. If the price remains above $1 the protocol lowers the collateral ratio (thus increasing capital efficiency) and if the price remains below $1 the protocol increases the collateral ratio (thus regaining the market’s confidence). Through this mechanism Frax allows the market to decide its collateral ratio.
Initially, the protocol increased and decreased its collateral ratio hourly in increments of 0.25%. This control system has been updated with a PID controller that now takes FXS’s growth ratio into account. The growth ratio is essentially a metric that measures the amount of FXS liquidity that is available in AMMs. When the growth ratio increases it is possible to redeem more Frax with a smaller overall percentage change in the supply of FXS. Considering that upon redeeming Frax the user is credited with collateral and newly minted FXS, a higher growth ratio implies that redeemers will incur smaller price slippages on FXS if they choose to sell. With higher growth ratios, the likelihood of negative feedback loops is therefore diminished.
Price Stability
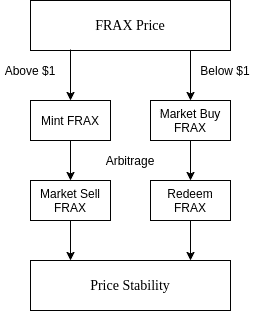
Although Frax has multiple mechanisms to stabilize its price (addressed in Section 6), arbitrage plays the most important role. Given that Frax can always be redeemed and minted for $1 worth of collateral and FSX, arbitrage opportunities arise whenever Frax deviates its value from the $1 peg.
If the price of Frax is above $1 there is an arbitrage opportunity to mint Frax for $1 worth of collateral and FXS and sell it on the open market for a higher price. Through this arbitrage process, the price of Frax on the open market will decrease until the dollar peg is restored and the arbitrage opportunity ceases to exist.
If the price of Frax is below $1 there is an arbitrage opportunity to buy Frax on the open market and redeem it for $1 worth of collateral and FXS. Similarly to the aforementioned scenario, the price of Frax will increase until this arbitrage opportunity ceases to exist.
It is worth noting that this arbitrage price stabilization mechanism can be hindered if the market loses its confidence in the protocol’s liquidity and solvency.
Buyback and Recollateralization
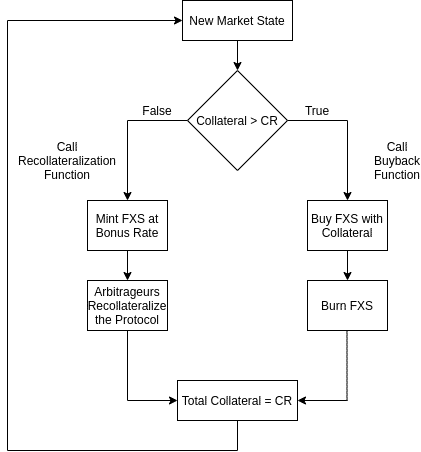
Due to Frax’s varying collateral ratio, there are periods when the protocol has a surplus of collateral and periods when the protocol has a deficit of collateral. To address this issue, Frax rebalances its collateral to the required ratio through two different mechanisms, buybacks and recollateralizations.
The recollateralization function checks if the total value of collateral locked in the protocol is smaller than the current collateral ratio. If this happens to be the case, the user that called the function can add collateral to the protocol in exchange for FXS minted at a discount rate.
The buyback function checks if the total value of collateral locked in the protocol is higher than the current collateral ratio. If that condition is met, the excess of collateral in the system is used to buy FXS and burn it. By doing so, the excess collateral is redistributed to all FXS holders.
AMOs
The protocol’s “Algorithmic Market Operations Controller” (AMO) is a collection of autonomous contracts that are responsible for Frax’s monetary policy. AMO controllers represent a modular mechanism that optimizes the protocol’s capital efficiency, adds new features to it (i.e. privacy), and ultimately drives more value to FXS holders by maximizing the overall system revenue and innovation. AMOs operate in a conservative way and they are limited by the collateral ratio. What this means is that AMOs cannot freely mint Frax; if at any given moment a recollateralization of the collateral ratio is required AMO operations are paused. Similarly to the protocol’s collateral ratio, AMOs rely on market forces to regulate logic operations.
Collateral Investor AMO
The collateral investor AMO invests idle USDC collateral in DeFi protocols (currently Aave, Compound, and Yearn) in order to increase its capital efficiency. The generated cash flow accrues to FXS holders by buying and burning FXS on the open market.
| Total USDC | Total Invested | Invested % of USDC |
| $115.8M | $65.4M USDC | 56.5% |
Curve AMO
The Curve AMO allows the protocol to transfer its idle USDC collateral or new Frax to its own Curve metapool, FRAX3CRV. What this implies is that the protocol is able to place both Frax and USDC into this pool, thus controlling the pool’s TVL. Due to Curve’s design, the protocol can sell large amounts of Frax directly into this pool before its price slips 1% (above this CR band the protocol requires recollateralization).
The amount of Frax that can be sold into this pool before the protocol needs to be recollateralized represents the minimum algorithmic Frax circulating supply that the protocol can safely support on the open market. Therefore, this amount of Frax effectively represents its algorithmic floor supply.
All admin privileges to this pool are controlled by Frax protocol. Ergo, the Curve AMO can define and collect admin fees directly to FXS holders. Through this pool, Frax is able to increase the protocol’s liquidity and consolidate its peg while simultaneously generating revenue.
Frax Lending AMO
The lending AMO enables the minting of Frax directly into money markets where users are able to borrow Frax instead of minting it. Given that all the Frax that is lent is overcollateralized by borrowers, this minting action poses no threat to the collateral ratio. The interest that is paid to borrow Frax is immediately accrued to the protocol as revenue.
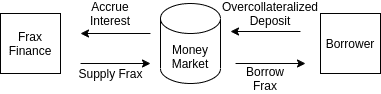
Furthermore, the protocol can adjust its interest rates on borrowing Frax. This is possible due to the fact that the system can mint Frax with minimal costs until its price drops 1% below its peg and requires recollateralization. If the protocol requires an interest rate decrease, it can easily do so by minting Frax, otherwise, it can burn Frax and increase its rates.
FXS1559
FXS1559 is an implementation that was recently introduced to every AMO and enables the autonomous buyback and burn of FXS with revenue generated from all AMOs. This process balances the collateral ratio by removing the excess of existing collateral within the system. Prior to this implementation, the buyback and burn of FXS had to be manually executed. To do so, it was necessary to stop all AMOs to withdraw their profits and buyback FXS.
With the implementation of FXS1559 that’s no longer necessary since it is possible to mint Frax against the excess collateral generated by AMOs and use it to buy back FXS. Therefore, this mechanism leverages the composability of Frax as money and the protocol’s ability to mint Frax at the collateral ratio in an extremely efficient manner that allows continuous FXS burns as long as there’s excess collateral to mint Frax. As of now, the daily burn rate corresponds to $20k worth of FXS. With new AMOs being created and improved, their revenue will likely increase alongside the burn rate.
Governance
The protocol’s governance is decentralized and collectively coordinated by FXS holders. In order to propose new changes to the protocol there’s a minimum threshold of 1% of the total votes (1,000,000 FXS). This threshold can be reached individually or alternatively users can pool their votes to submit new proposals. Once a proposal has been submitted an active voting period of 3 days begins. This voting is subject to a minimum threshold of 4,000,000 FXS votes. If this threshold is reached and the majority votes in favor the change is queued into Timelock (a contract that’s responsible for executing proposals) where it can be implemented after 2 days.
Frax Finance has a governance-minimized ethos that avoids the active management of protocol parameters. Currently, the protocol parameters decided through the governance process are:
- Adding and adjusting collateral pools;
- Adjusting minting and redeeming fees;
- Refreshing the collateral ratio’s rate;
The initial distribution of Frax Finance’s governance token is given as follows:
- Community Allocation – 60% of FXS’s initial supply will be distributed through liquidity programs that will last for approximately 3 years, the majority of which will be distributed during the first year;
- Development Fund – 5% of FXS’s initial supply is allocated to the project treasury, grants, partnerships, and security bug bounties;
- Team and Founders – 20% of FXS’s initial supply is allocated to the project’s team;
- Accredited Private Investors – 12% of FXS’s initial supply will be distributed to investors that participated in the project’s seed round, 2% of those tokens were unlocked at launch, 5% are vested over the first 6 months and the remaining 5% are vested over 1 year with a 6 months cliff;
- Strategic Advisors and Early Contributors – 3% of FXS’s initial supply will be distributed to initial advisors that aided the project in its initial stage, this allocation has 3 years vesting period;
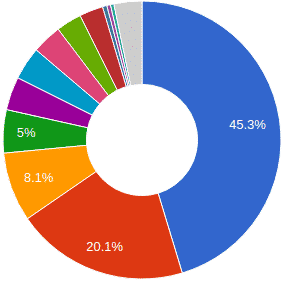
Presently, the protocol has 2721 unique token holders and the protocol’s governance token, FXS, has the token distribution represented below.
Tokenomics
Frax Finance has two different tokens, FRAX, which is the protocol’s stable token that is pegged to the US dollar, and FXS, which is the governance and value accrual token. The protocol’s economic model concentrates its potential upside and downside in FXS. Assuming that Frax’s demand and adoption grows, there would be more FXS being burnt than minted and its supply would be deflationary, otherwise, there will be a surplus of FXS being minted and the token would be inflationary.
The total supply of FXS was initially set to 100M tokens, nonetheless, this supply isn’t fixed and it will fluctuate depending on the amount of FXS that is burnt and minted. Redeeming Frax is the only way to mint FXS, however, new FXS is also added to the circulating supply through Frax’s liquidity programs.
The entire revenue generated by Frax Finance accrues to FXS holders through token burns that effectively distribute all profits generated by the protocol. This revenue is coming from minting and redeeming fees, seigniorage, excess collateral, and yield generated by Frax’s AMOs. Considering that all revenue is captured by FXS holders, it is possible to conclude that there are robust intrinsic incentives to hold the token.
The liquidity programs that the protocol has in place represent the main source of systemic sell pressure for FXS. In order to improve its tokenomics, the protocol has recently lowered the emission rate of FXS from 56,000 FXS/day to a rate of 49,315 FXS/day through the removal of the CR boost. This boost was negatively correlated with the collateral ratio and represented a uniform boost across all emissions thus benefiting farmers with no long-term commitment to the protocol. As of now, the only stakeholders that receive any kind of boost in inflationary rewards are the ones with aligned long-term incentives through locked liquidity.
Lastly, the protocol has recently introduced a new improvement to its tokenomics with the implementation of FXS1559. This implementation enables autonomous buybacks of FXS with revenue provenient from AMOs that consequently reduce FXS’s supply. At the current rate, this represents a daily burn rate of $20K worth of FXS. Considering that the emission rate of FXS is approximately 15x larger than the current burn rate it is possible to conclude that in the short/medium term the primary demand for FXS will rely on market speculation. In addition to this, Frax Finance has also an upcoming tokenomics improvement that will provide a single asset staking functionality for FXS (this will be discussed in the “Future Implementations” section).
Frax Finance Analysis
Price Stability
Unlike most algorithmic stablecoins, Frax isn’t exposed to violent cycles of contraction and expansion that compromise its commitment with a stable peg. In fact, Frax was the best performing algorithmic stablecoin in terms of stability during Q1 2021.
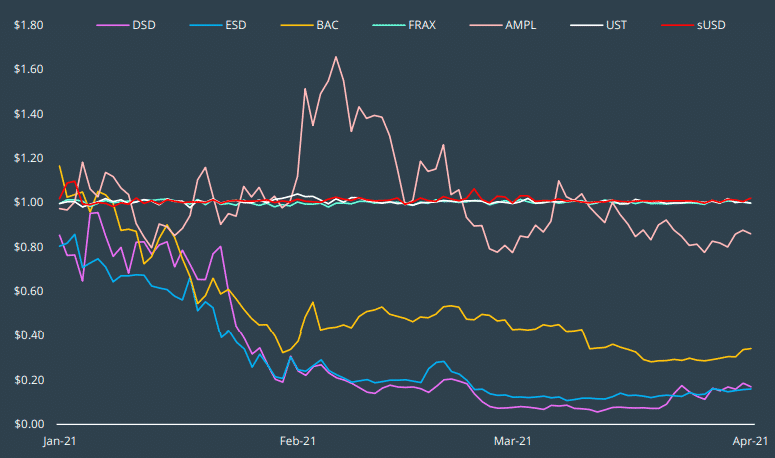
(source: Coingecko)
This impressive performance in terms of stability (which should be the main purpose of any stablecoin), can be justified by Frax’s partially collateralized dual-token model. This innovative model allowed Frax to achieve an impressive average peg price of $1.001 during Q1 2021.
Capital Efficiency
A high level of capital efficiency enables a stablecoin that is cheaper to use, this is reflected in lower lending/borrowing rates and highly liquid credit creation. The dilemma within the creation of new algorithmic stablecoin models has always been tied to the compromise between price stability and capital efficiency. Overcollateralized stablecoins offer high confidence in their price stability and low capital efficiency, undercollateralized stablecoins offer a high capital efficiency and low confidence in their price stability. Due to its novel partially collateralized algorithmic model, Frax lets market forces define the optimum equilibrium between both parameters thus achieving the best possible compromise.
By analyzing Cream Finance lending and borrowing rates (Frax lending AMO’s money market), it is possible to assess Frax’s capital efficiency when compared to other pegged stablecoins.
| Rate | Frax | USDT | USDC | BUSD | DAI | ESD | UST | sUSD |
| Lending | 0.09% | 11.04% | 13.5% | 12.06% | 9.92% | 0.02% | 9.73% | 5.81% |
| Borrowing | 3.41% | 21.07% | 21.87% | 20.70% | 19.38% | 2.47% | 19.80% | 15.40% |
(source: Cream Finance)
In terms of capital efficiency, Frax outperforms all pegged stablecoins with one predictable exception, ESD (also an algorithmic stablecoin). Considering that ESD is supposed to be pegged to the US dollar and it has a current price of $0.17 it is simple to conclude that it lacks the intrinsic price stability that any pegged stablecoin should attain. Despite its high capital efficiency, ESD is therefore disregarded from this analysis given that it doesn’t fulfill the required compromise between efficiency and stability.
| Metric | Lending | Borrowing |
| Average Rate | 7.77% | 15.51% |
(source: Cream Finance)
Considering the average lending and borrowing rates of the stablecoins that were analyzed, it is trivial to conclude that Frax had the best performance during Q1 of 2021 in terms of price stability and capital efficiency.
Frax Price, Supply and Market Capitalization
Currently, Frax is in 16th place by market capitalization. Considering there are multiple $1B+ algorithmic stablecoin projects that have yet to prove their ability to maintain a stable peg, it is possible to conclude that Frax could be poised to grow beyond its current market capitalization.
| Stablecoin | Price | Supply | Market Cap. | 24h Volume |
| Frax | $0.99 | 115.63M | $114.8M | $8.2M |
FXS Price, Supply and Market Capitalization
While conducting fundamental analysis on a DeFi protocol, speculative metrics such as the performance of its native token are usually secondary parameters that merely indicate asymmetries in the protocol’s comparative valuation. Regardless, that’s not the case with Frax Finance, taking into account that the protocol has an algorithmic component of collateral that’s supported by FXS it becomes crucial to monitor its market capitalization to ensure the protocol’s solvency.
| Token | Price | Circ. Supply | Circ. Market Cap. |
| FXS | $4.64 | 10.52M | $49M |
Frax Collateral Distribution
The market capitalization of Frax is distributed through several components, idle USDC, AMOs that generate revenue, and its algorithmic component. Frax’s algorithmic component must always be smaller than FXS’s market capitalization.
| Compound (cUSDC) | USDC | Yearn (yUSDC) | Algorithmic (FXS) | AAVE (aUSDC) | Curve AMO | Total |
| $30M | $20.5M | $20.3M | $16.5M | $15M | $13.2M | $115.5M |
(source: Coingecko)
AMO Metrics
Collateral Investor AMO
The Collateral Investor AMO invests idle USDC collateral in DeFi protocols that generate revenue and increase Frax’s capital efficiency. The revenue created by all AMOs accrues to all FXS holders through token burns.
| Investor AMO | Compound (cUSDC) | AAVE (aUSDC) | Yearn (yUSDC) | Total |
| Allocation | 46% ($30M) | 23% ($15.1M) | 31% ($20.3M) | $65.4M |
| APY | 2.87% | 5.71% | 16.94% | 8.81% |
Frax Finance is pursuing a meta governance strategy where the protocol chooses to hold farmed reward tokens (such as COMP) in order to accrue governance power over the DeFi platforms that it uses. Additionally, this is also an act of good faith that aids the integration of Frax within DeFi. Currently, the investor AMO has $200.45K in unspent profits that will be used to burn FXS.
Curve AMO
Currently, the Curve AMO owns 74% of FRAX3CRV’s total value locked. As aforementioned, Frax Finance is able to control this pool’s TVL by depositing USDC and Frax.
| Pool | AMO Liquidity | Non-AMO Liquidity | FRAX/3POOL Ratio | Base APR | Admin Fee | Total Fee |
| FRAX3CRV | $13.2M | $4.6M | 52.90% | 0.65% | 0.02% | 0.04% |
Lending AMO
The lending AMO allows the protocol to directly mint Frax into money markets such as Cream Finance while simultaneously earning interest rates. Given that these contracts are overcollateralized, this AMO does not lower the direct collateral ratio. It is important to note that this AMO has been recently implemented thus its metrics do not reflect its future potential.
| Lending AMO | Amount Minted | Profit | APY |
| CREAM | 250K FRAX | 2.8K | 0.09% |
(source: Frax Finance)
Liquidity Programs
Liquidity programs allow protocols in their early stages to bootstrap liquidity, catalyze growth, and distribute the protocol’s governance to the community. Frax Finance has allocated 60% of its supply (60,000,000 FXS) for this purpose. This large allocation will be distributed according to a long distribution schedule that will take years to be completed. Additionally, the maximum lockup period while providing liquidity is 3 years. Users that choose to lock their liquidity will benefit from the time-locked staking boost that will increase their proportion of the pool while decreasing the proportion of non-locked LPs. This boost is therefore a zero-sum game that rewards long-term liquidity providers. All FXS rewards accrued by locked LPs are unvested.
| Metric | FRAX/FXS | FRAX/WETH | FRAX/USDC |
| APR | 47.67% – 143.02% | 32.20% – 96.59% | 18.32% – 54.97% |
| TVL | $27.90M | $50.71M | $121.53M |
As expected, the pool with the largest TVL and lowest APR is the FRAX/USDC pool due to its minimized impermanent loss risk. Analogously, the pool with the lowest TVL and highest rewards corresponds to the FRAX/FXS pool due to its inherent risk of impermanent losses. Investors that are long FXS must measure the impermanent loss risk to hedge their investment.
| Metric | FRAX3CRV |
| APR | 24.40% – 73.20% |
| TVL | $17.8M |
(source: Frax Finance)
Similar to Uniswap’s FRAX/USDC pool, Curve’s FRAX3CRV has a lower APR due to the minimized risk of impermanent losses.
| Metric | FXS/WETH | FRAX/FXS |
| APR | 33.69% – 67.38% | 30.14% – 60.27% |
| TVL | $1.20M | $1.23M |
Sell Pressure
While analyzing the intrinsic sell pressure that any token is exposed to, it is necessary to understand the system dynamics that contribute to the token’s dilution and the risks associated with major token holders (i.e. early investors).
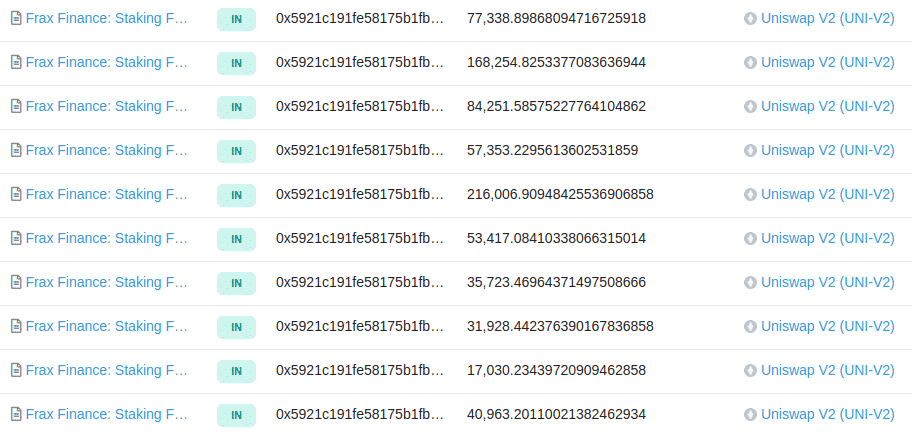
Currently, the major sources of sell pressure for FXS lie in major farmers liquidating their liquidity mining rewards (i.e. a large liquidity provider that was contributing $12M to several Frax pools sold 250,000 FXS at $5 from a single wallet). Addresses such as “0x5921c191fe58175B1fb8943ED3F17345e615fF02” are valid examples of this; the transactions listed below are 9 days old.
Furthermore, it is worth noting that 10M FXS tokens will be released to early investors in June. This amount corresponds to approximately 10% of FXS’s supply. This selling pressure is significant but it is typical in early-stage projects. As the protocol matures, the ownership of FXS tokens will become further decentralized and these risks will be mitigated.
Frax Market Capitalization and FXS Supply
The burn rate of FXS is a function of multiple factors such as Frax’s demand, the revenue from the protocol’s AMOs, and platform fees. Considering these three components it is important to understand what’s the determinant factor that affects FXS’s supply reduction.
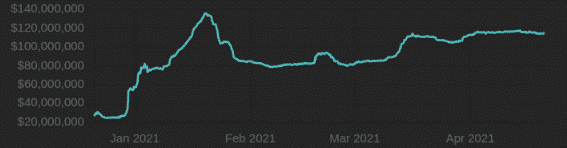
Taking into consideration that the peak in Frax’s market capitalization (thus the peak in its demand) occurred on the 21st of January it would be expected that if the demand for Frax represents the predominant factor in the protocol’s burn rate FXS’s supply would have a minimum at that point.
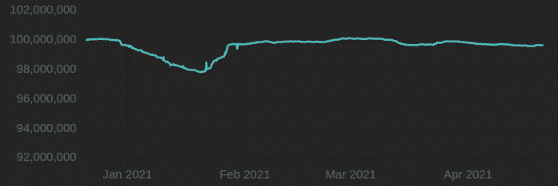
Given that the previous assumption is verified and the peak in Frax’s market capitalization corresponds to the bottom in FXS’s supply (on the 21st of January) it is safe to assume that currently, the demand for Frax represents the driving force in the protocol’s burn rate. As new AMOs are deployed and capital efficiency is improved with promising models such as the lending AMO, the direct correlation that exists between Frax’s demand and FXS’s supply will likely decrease.
A similar assumption can be made regarding the protocol’s collateral ratio. Considering that growing demand for Frax will lead to buybacks and fees that will decrease FXS’s supply through token burns (while simultaneously increasing the market’s confidence in Frax’s peg) it is trivial to conclude that the protocol’s overall collateral ratio will decrease.
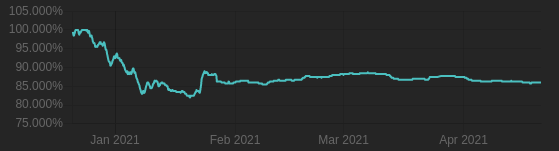
As expected, the minimum point in Frax’s collateral ratio (82.5%) corresponds to the peak in Frax’s demand. At this level, Frax reached its historic maximum in capital efficiency and in the market’s confidence in Frax’s algorithmic component.
| Maximum Frax Market Cap. | Minimum FXS Supply | Minimum Collateral Ratio |
| $135M | 97.8M | 82.5% |
(source: Frax Finance and Coingecko)
Assuming that in the long term Frax’s demand grows FXS’s supply will become deflationary due to an increase in its burn rate. As of now, the protocol’s FXS emission rate is approximately 15x larger than its current burn rate.
Community Metrics
Frax Finance’s development team and community are extremely active on Telegram. While conducting this report all questions posed to the team and community were promptly answered and it was possible to conclude that the community contributes to the protocol’s innovation.
| Social Network | Number of Users |
| Telegram | 5.9k |
| 8.7k |
(source: Telegram and Twitter)
Limitations and Risks
Pegged algorithmic stablecoins either have no collateral (i.e. AMPL) or they are partially/fully collateralized by their native token (i.e. Frax and sUSD). This definition implies that solvency is a systemic risk that is inherent to this model.
There are few known examples that were successful in retaining the utilitarian pegged stability that is required in a stablecoin while simultaneously maximizing its capital efficiency. Usually, the models that are successful at achieving this commitment either require over-collateralization (sUSD is overcollateralized by SNX) or in Frax’s case a partially collateralized model that is sustained through its native token and external collateral (Terra’s UST is another notable example where stability is attained through Luna’s arbitrage).
The common denominator that is observed in successful algorithmic stablecoin models is the dual token system that absorbs the volatility that is intrinsic to cycles of expansion and contraction. Through this model, insolvency risks can be minimized but never eliminated.
Frax Finance’s stablecoin is able to further minimize this risk by providing a greater solvency safety margin through its dynamic collateral ratio that adapts the protocol’s collateral reserves according to the market’s supply and demand for both Frax and FXS.
Regardless, there is a non-negligible risk for the protocol’s solvency if a sudden collapse in its native token’s market capitalization was to occur. In this scenario, the protocol wouldn’t be able to recollateralize its collateral ratio and the minted FXS at a bonus rate would prove to be an insufficient incentive for arbitrageurs. This sequence of events would then offset a negative reflexive spiral where Frax would ultimately break its peg.
In fact, the act of minting Frax represents a pseudo loan from Frax holders to FXS holders, the protocol is therefore borrowing against future earnings. If FXS’s market capitalization suffers a rapid decline, Frax holders won’t be able to be repaid when exiting the system because FXS’s market capitalization is insufficient to repay the protocol’s outstanding debt.
Considering this risk, it is crucial for the protocol’s solvency to guarantee that Frax’s algorithmic component is far lower than FXS’s market capitalization. As of now, the protocol takes into consideration the protocol’s growth ratio that measures FXS’s liquidity that is present in AMMs. By doing so, the protocol adjusts its collateral ratio accordingly thus minimizing its insolvency risk.
Future Implementations and Improvement Proposals
Frax Finance’s modular AMO structures that enact the protocol’s monetary policy represent the main catalyst for innovation at a protocol level. As of now, the development team is working on multiple solutions that will ultimately improve the protocol’s capital efficiency while simultaneously preserving its collateralization requirements. The list of future implementations that are currently in development is addressed below.
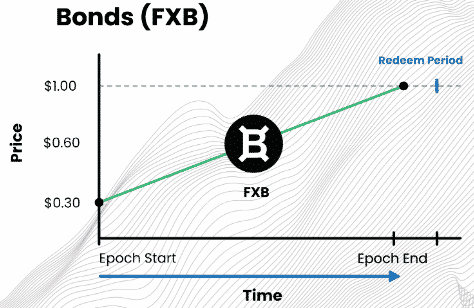
Bonds (FXB) & Interest Rate AMO
This AMO issues FXB tokens (on a constant product curve) that represent protocol debt. Through FXB, Frax redeemers are incentivized to hold the protocol’s bond tokens with an interest rate yield on Frax instead of redeeming their Frax and immediately increasing the selling pressure on FXS. With this mechanism, the protocol is able to soften rapid declines in FXS’s market capitalization during Frax’s contraction cycles by distributing FXS’s sell pressure over FXB’s maturity timeline.
Given that FXB’s interest rates are adjustable, redeemers can be proportionally incentivized during violent Frax contraction cycles. Due to this, FXB adds an extra layer of security to the protocol’s solvency through aligned incentives. At its maturity (which is variable), FXB can be redeemed for $1.
This AMO’s liability lies in the fact that the AMO can be shut down if its operation requires the protocol’s recollateralization. This scenario can occur if the newly minted Frax that’s required to pay the interest rates of bondholders at maturity drops the protocol’s collateral ratio. Under these circumstances, the AMO is paused until the collateral ratio is restored.
Collateral Hedge AMO
The purpose of the Collateral Hedge AMO is to allow Frax Finance to support more diverse and unstable forms of collateral. To do so, the AMO uses existing collateral and hedges it with inverse positions thus minimizing eventual crashes in the collateral’s price. As of now, the development team is exploring Synthetix inverse assets for this purpose (i.e. ETH and iETH).
Tornado Cash AMO
This AMO will allow the direct minting of Frax into Tornado’s anonymity sets. By leveraging zero-knowledge technology the protocol aims to provide optional privacy to its stablecoin. If the demand for privacy grows, Frax Finance will have exposure to that expansion through this AMO. The current limitations for this implementation lie in gas costs that must be optimized through L2 solutions.
FXS Single Asset Staking
In order to improve FXS’s tokenomics the development team is currently working on a single asset staking solution. This mechanism will leverage the existing FRAX/USDC and FRAX3CRV farms without the risk of impermanent loss for stakers (this strategy’s design is currently under development). Additionally, this solution will provide utilitarian value to the protocol by increasing Frax’s liquidity and tightening its peg.
Given the increasing demand for single asset staking solutions FXS’s value proposition will be greatly improved with this implementation that will reinforce the existing incentives to hold FXS.
New Forms of Collateral
The protocol’s development team is currently ideating the expansion of new forms of collateral beyond USDC in order to decentralize the protocol’s collateral reserves. As of now, the development team is looking into working with Maker to transition part of its collateral to DAI. It is important to note that the introduction of DAI into Frax’s collateral reserves can have a potential impact on Frax’s capital efficiency (thus increasing its lending/borrowing rates) due to its overcollateralized nature. Furthermore, the protocol is also considering the addition of stable assets such as RAI, OHM, and FLOAT.
Improvement Proposals
While researching Frax Finance it was possible to elaborate the following optimizations that can potentially maximize the system’s lending AMO revenue and add new functionalities to the protocol:
- Lending AMO Monetary Policy – The protocol can update its current lending AMO with a “Monetary Policy ” implementation that would control the protocol’s borrow and supply rates by modulating the amount of Frax that’s supplied within the recollateralization minting margin. By doing so, the protocol can adjust its competitiveness in a dynamic manner in order to outperform the capital efficiency offered by other stablecoins at an optimal revenue rate (i.e. if Frax’s current supply rates were increased this AMO would generate more revenue while simultaneously outperforming its closest competitor in terms of capital efficiency).
- ETH Vaults – Frax Finance can be seen as a fractional version of MakerDAO’s PSM that uses market forces to define how much collateral the system actually needs instead of overcollateralizing the protocol. As a result, the protocol could hypothetically create vaults that would accept ETH as collateral thus fulfilling the increasing demand for ETH backed stablecoins with higher capital efficiency. In this scenario, FXS would play MKR’s role in the price stability module, by doing so the protocol would be able to offer the same experience as MakerDAO with lower liquidation ratios (MakerDAO’s liquidation ratio times the collateral ratio.
Conclusion
Frax Finance lets the market define the amount of unbacked cash that the protocol is allowed to create. This fine balance enabled through its fractionally collateralized model lets market forces determine the optimum equilibrium between capital efficiency and the market’s confidence in Frax’s peg.
What this implies is that Frax is the only algorithmic stablecoin whose capital efficiency is priced in by the market. When compared with overcollateralized stablecoins Frax is cheaper to use due to its higher capital efficiency that is reflected in lower lending/borrowing rates and more liquid credit creation. When compared with undercollateralized stablecoins Frax is the best performer in terms of price stability.
Unlike other undercollateralized algorithmic stablecoins (such as Empty Set Dollar), Frax isn’t exposed to violent cycles of contraction and expansion that would otherwise compromise its commitment with price stability. This is only possible due to Frax’s novel algorithmic model that makes no assumptions regarding a collateral ratio that should be targeted while simultaneously letting the market define the amount of unbacked Frax that the protocol is allowed to create.
The bullish thesis for Frax Finance lies in a demand growth for Frax that is driven through its partially collateralized model. This model introduces a dynamic point of equilibrium ruled by supply and demand forces that reflect the market’s confidence in Frax’s peg while simultaneously rebalancing its collateralization ratio accordingly. By doing so, the protocol is able to optimize both capital efficiency and price stability. As Frax’s market capitalization grows, its success will be captured by FXS through the seigniorage that’s intrinsic to the minting process. If Frax Finance succeeds and achieves widespread adoption throughout DeFi its value capturing token supply will become deflationary. Furthermore, Frax’s modular AMOs are a catalyst for innovation that grants Frax Finance the ability to evolve its monetary policy according to new market conditions.
The bearish thesis for Frax Finance lies in the systemic risk that is intrinsic to its undercollateralized component (this risk is a common denominator among undercollateralized algorithmic stablecoins). If FXS’s market capitalization is subject to an unforeseen rapid decline the protocol’s ability to recollateralize its collateral ratio will be jeopardized. Under these circumstances, the incentives provided by the protocol in the form of FXS minted with a bonus rate would prove to be insufficient for arbitrageurs. This liability will be magnified during bear markets when FXS’s market capitalization will be exposed to possible selloffs that can offset this reflexive sequence of events that could ultimately break Frax’s peg. It is worth mentioning that this risk is greatly minimized due to Frax’s PID controller that takes into account the protocol’s growth ratio. This metric, which represents the percentage of FXS’s supply that’s available on AMMs, allows the protocol to take its governance token’s liquidity into account thus minimizing this solvency risk by increasing the protocol’s collateralization ratio when its liquidity decreases.
In summary, the demand for capital efficiency within DeFi has accelerated the growth and expansion of algorithmic stablecoins where price stability remains an issue. With its innovation, Frax Finance introduces an optimal solution to the efficiency/stability dilemma thus proving itself as one of the leading algorithmic models within pegged algorithmic stablecoins.
Disclosure: Albaron Ventures maintains policies designed to manage conflicts of interest related to its investment activities. Albaron Ventures abides by a No Trade Policy for the assets listed in this report for 3 days following its public release. At the time of publication, Albaron Ventures is farming FXS through the Curve pool.
References
- Frax Finance. (n.d.). Frax Documentation. Retrieved April 12, 2021, from
- Medium. (2021, March). Frax V2 AMO. Retrieved April 16, 2021, from
https://samkazemian.medium.com/frax-v2-algorithmic-market-operations-b84521ed7133
- Deribit Insights. (2020, December). Stability, Elasticity, and Reflexivity: A Deep Dive into Algorithmic Stablecoins. Retrieved April 19, 2021, from
Stability, Elasticity, and Reflexivity: A Deep Dive into Algorithmic Stablecoins
- CoinGecko. (2021, April). Q1 2021 CoinGecko Report. Retrieved April 20, 2021, from
https://www.coingecko.com/buzz/q1-2021-quarterly-cryptocurrency-report
- Kwon, D. et al (2019, April). Terra Money: Statility and Adoption.
https://terra.money/Terra_White_paper.pdf