Introduction
Ethereum’s decentralized finance (DeFi) ecosystem experienced rapid growth throughout 2020 with the adoption of novel concepts such as Automated Market Makers (AMMs) that created the required liquidity to catalyze DeFi’s rise. With the introduction of AMM-based decentralized exchanges and a progressively higher level of protocol composability within Ethereum’s ecosystem, the practice of yield farming was created.
Yield farming is a method of optimizing/maximizing the rates of return over one’s capital by leveraging multiple DeFi applications (such as money markets, derivatives, and AMM protocols). The movement and rotation of such liquidity while seeking the highest annual percentage yields (APYs), involves various mechanisms such as risk choice (higher risk premiums imply higher APYs), liquidity mining, and leverage. Yield farming strategies generally involve lending/borrowing, supplying capital to liquidity pools, and staking LP tokens.
DeFi applications and on-chain actions often require the use of distinct pegged value crypto assets such as stablecoins pegged to FIAT currencies (i.e., USDT, DAI, and USDC) or tokenized forms of Bitcoin (i.e., wBTC and renBTC). With the advent of yield farming and DeFi’s growth, the demand for swapping between pegged value crypto assets with minimum slippage created an opportunity for DeFi protocols with optimized bonding curves specifically designed for a decentralized exchange (DEX) of pegged value assets.
This report will be focused on the analysis of a yield farming protocol, mStable, that leverages the composability enabled by DeFi and efficiently combines swapping, lending, and meta-pegged crypto assets in a single standard.
What is mStable?
mStable is a DeFi protocol that aims to reduce the fragmentation and lack of native yield in pegged crypto assets while providing protection against capital loss through diversification and future re-collateralization mechanisms. With a unified liquidity pool for each pegged crypto asset, mStable is able to provide a stablecoin infrastructure building block that can be further used in other decentralized financial applications.
mStable’s assets (mAssets) represent both a pegged value and a share of the reserves in their respective liquidity pools. Each mAsset is fully backed by a basket of underlying same-peg tokenized assets (bAssets) whose weights can vary. These baskets are flexible and new bAssets can be added, removed, or adjusted. This flexibility guarantees that all mAssets can adapt to new market conditions under one unified meta-pegged crypto asset. Currently, there are two mAssets: mUSD and mBTC.
With its AMM design, mStable is able to unify lending and zero-slippage swapping into one standard. By doing so, the protocol earns both interest rates and trading fees, which are used to generate mAsset’s native yield. This is achieved by lending the deposited bAssets that collateralize each basket to third-party money markets and by allowing these same-peg bAssets to be swapped among them.
The protocol’s governance is decentralized and collectively coordinated by Meta Governors that stake their MTA tokens (mStable’s native token) in order to participate in the governance process.
How is the protocol structured?
mStable has five main functions within its protocol.
Mint and Redeem
The Mint and Redeem functions allow users to deposit/withdraw funds by exchanging the underlying bAssets and mAssets. As a result, mAsset’s circulating supply will fluctuate. It is worth noting that in an extreme scenario where one or more bAssets reach the basket’s minimum or maximum weight limits these functions will be affected and individual asset minting/redeeming will be replaced by ”multi” asset minting/redeeming.
Swap
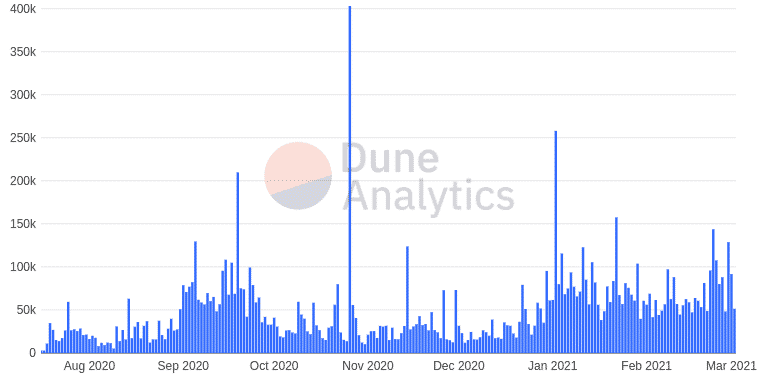
Swap is mStable’s function that allows users to swap same-pegged assets present in its liquidity pools with either zero or low slippage and a fixed trading fee. The efficient exchange of pegged crypto assets and the arbitrage opportunities that exist within Swap attract both traders and arbitrageurs that generate earnings for mStable’s protocol through trading fees. The earnings generated from these fees are then accrued to mAsset’s native interest rates through Save.
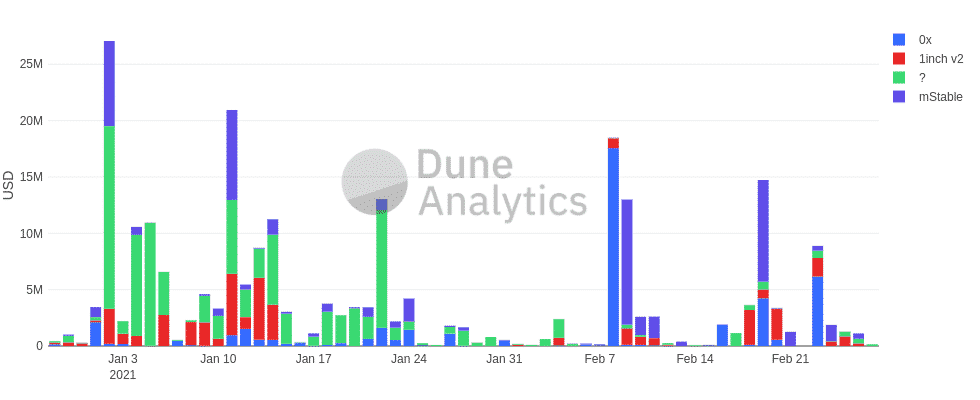
(source: Dune Analytics)
Given that Swap only supports the exchange of same-pegged assets, its bonding curves are optimized for that purpose while the risk of impermanent losses is minimized.
Currently mStable uses the following AMM models:
• mUSD – Constant Sum Market Maker (CSMM);
• mBTC – StableSwap (introduced by Curve);
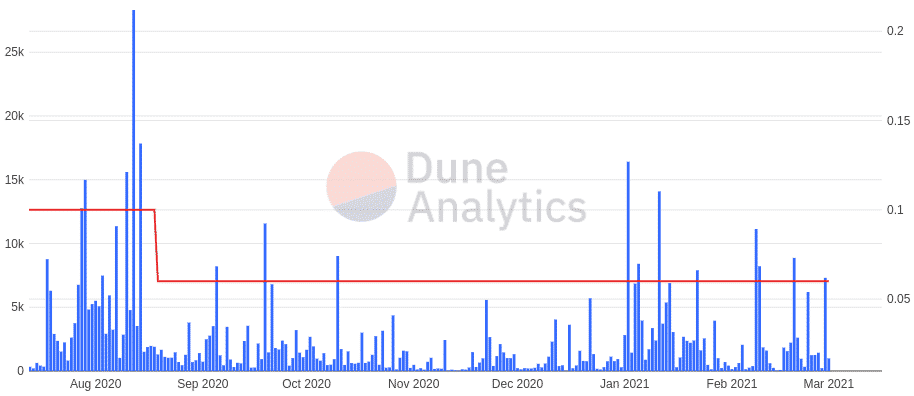
The CSMM model allows bAssets to be swapped 1:1 with zero-slippage, however, it introduces some issues that will later be addressed. StableSwap behaves in tandem with a CSMM if bAsset’s weights are within the target weight range. When bAsset’s weights fall outside the target weight range and the portfolio becomes imbalanced, StableSwap adopts a bonding curve that’s similar to a constant-product invariant. By doing so StableSwap’s model creates incentives and disincentives that allow bAsset’s weights to converge to the target weight range.
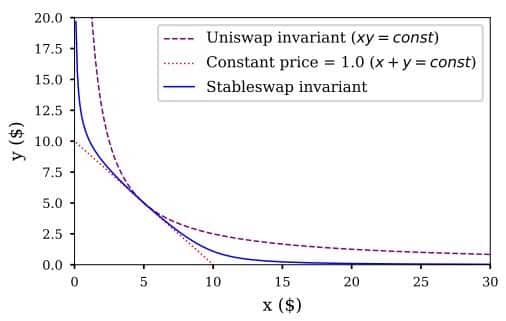
(source: Dune Analytics)
Save
Save is a high yield savings account that simplifies yield farming’s complexity and allows users with any level of experience to easily participate in DeFi and earn a native yield over their mAssets. The native yield that’s inherent to all mAssets is obtained from swap fees, interest rates over bAssets, and other sources of income such as the automatic liquidation of accrued reward tokens from lending platforms.
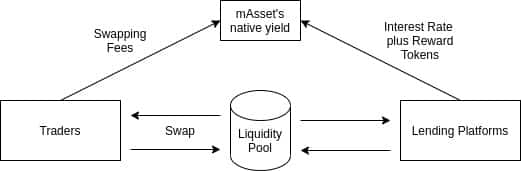
In order to generate interest rates over bAssets, mStable’s smart contracts autonomously deposit bAsset’s to lending platforms (suchlike AAVE and Compound), which generate interest rates and reward tokens that are subsequently accrued to swap fees. Through this composable process, mStable is able to create mAsset’s native yield by efficiently combining swapping and lending.
Save V2 has been recently introduced and implemented to mStable’s protocol creating crucial improvements in its composability. As a result of this second iteration, mStable’s Save is now tokenized. This means that when a deposit is made to Save, the depositor is credited with a token that represents the deposit through an interest-bearing mAsset (imAsset).
This improvement led to the following consequences:
• Composability – imAssets can now be used within other DeFi protocols as low-volatility interest-bearing forms of collateral;
• Capital efficiency – mAssets deposited in Save can be used to generate even more yield beyond what’s already generated by the underlying collateral (bAssets);
Finally, all of Save’s depositors can participate in mStable’s governance process by depositing their imAssets in Save’s vault. While doing so, the depositor is rewarded with MTA. This vault was designed as an incentive that aims to increase participation in mStable’s governance process. By participating in the governance process, the user earns more MTA and accrues vMTA, which can be subsequently used to boost imAsset’s Vault rewards.
Earn
This yield farming product is designed to incentivize liquidity and decentralize mStable’s governance through the distribution of MTA tokens to liquidity providers. Presently, users can earn MTA rewards by contributing to incentivized liquidity pools from Curve, Balancer, and Uniswap. These pools and incentives are decided through mStable’s decentralized governance process.
Governance
mStable’s governance is decentralized and collectively coordinated by Meta Governors through the Meta token (MTA). Governors have their MTA tokens staked and are incentivized to participate in the governance process where proposals are finalized through on-chain signaling. While staking MTA the user receives vMTA that can be used to vote on proposals, boost imAsset’s Vault earnings and receive staking rewards. In the future, MTA will also act as a source of re-collateralization for mAssets.
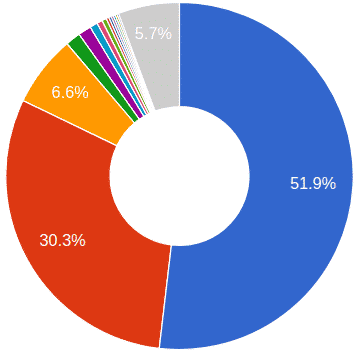
(source: Bloxy)
Tokenomics
While analyzing the tokenomics that are associated with any given token it’s necessary to evaluate the intrinsic incentives to hold it, the systemic selling pressure that the token is exposed to, and its sources of demand.
Presently, the circulating supply of mStable’s governance token, MTA, corresponds to 18.5% of its maximum supply that’s capped at 100M tokens. This low initial circulating supply allows a long-term gradual emission of tokens that will favor the decentralization of token holders and create incentives to bootstrap the protocol’s liquidity and usage. Nonetheless, this initial distribution strategy comes at the cost of constant selling pressure due to the inflationary incentives that it creates.
The distribution of earnings to holders that stake their tokens represents a robust valuation base for a protocol token as it rewards the holder with tangible cash flows. This model can be found in protocols like SushiSwap and Curve where part of the platform’s fees are distributed to holders, thus representing effective revenue that can be expressed in objective metrics such as the price to sales ratio.
Considering that mStable has no revenue that’s distributed to token holders, nor any need to hold MTA to interact with its platform, there are no efficient incentives to create a value proposition to hold the token except for community members and long term holders that want to exercise their voting influence through the governance process.
mStable is currently trying to improve its tokenomics through a ”buy and make” proposal that will divert earned fees to a liquidity pool in order to generate a source of demand for MTA, while simultaneously providing utility. This proposal will be addressed in the ”Future Implementations and Proposals” section.
mStable within DeFi
At a protocol level, mStable’s only direct competitor is DeFiDollar. Similar to mStable, DeFiDollar leverages protocol efficiency and composability to validate its value proposition within DeFi. It does so by combining lending, swapping and native pegged crypto assets. A crucial differentiating factor between both protocols lies in the fact that mStable has its own AMM-based decentralized exchange while DeFiDollar relies on Curve’s protocol for collateralization.
Besides DeFiDollar, mStable also competes at a functional level with decentralized exchanges of pegged assets. Therefore, protocols such as Curve are equally valid in establishing a comparative analysis at a functional level with mStable’s swap function.
Lastly, mStable’s native pegged crypto assets will also be juxtaposed for liquidity comparisons within their asset class.
This comparison of mStable within the DeFi ecosystem will be structured as follows:
• Decentralized Exchanges of Pegged Assets;
• mStable versus DeFiDollar;
• Pegged Crypto Assets;
Decentralized Exchange of Pegged Assets
mStable’s Swap function can be appropriately compared with multiple AMM-based decentralized exchanges that incorporate bonding curves designed for same-pegged assets. Curve, Swerve, Shell, Component, and Saddle fit these criteria, however, this analysis will emphasize Curve due to its leading role in this sector.
Adoption Metrics
The Total Value Locked (TVL) in a DeFi project represents an important metric to evaluate the adoption scale of a protocol. Nevertheless, it’s important to keep in mind that this is a metric that can be influenced by incentive mechanisms. TVL can also be a skewed indicator while comparing liquidity providers as it doesn’t take into account the utilization rate of the locked capital.
| Metric | Curve | mStable | Saddle | Swerve | Component | Shell |
| TVL | $4.06B | $46.2M | $54M | $15.3M | $37.7M | $121K |
(source: Dune Analytics)
The Curve stands out as the leading decentralized exchange of pegged crypto assets. However, the fragmented liquidity that exists within this sector points to a growing number of different AMMs with liquidity that is distributed throughout its ecosystem. This fragmentation creates an opportunity for liquidity aggregators.
TVL by itself is an incomplete metric. Therefore, in order to have a more holistic view of the actual adoption of these DeFi protocols, metrics such as the number of users can be applied to complement this information. For that purpose, the protocol’s degree of decentralization will be assessed through its governance token and the corresponding number of unique holders (Component and Saddle have yet to release their governance tokens thus they will be excluded).
| Metric | Curve | mStable | Swerve | Shell |
| # of holders | 21904 | 6806 | 2619 | 197 |
(source: Bloxy)
As expected, the distribution that exists in terms of unique governance token holders is correlated with the protocol’s TVL. Nonetheless, Curve’s adoption scale in terms of users remains significantly inferior when compared to protocols with a lower TVL such as Uniswap (166k unique token holders). Metrics such as the number of unique traders count and average trade size confirm that Curve is mainly used by high volume traders that compose most of its TVL.
Traded Volume and Earnings
In order to evaluate a protocol’s actual rate of utilization, it’s necessary to analyze its traded volume and the respective earned fees.
| Metrics | Curve | mStable |
| Traded Vol. (7 days average) | $110M | $3.5M |
| Earned Fees (7 days average) | $44k | $2.1k |
(source: Dune Analytics)
The ratio between Curve and mStable in terms of TVL and daily earned fees:
• TVL = x88;
• Earned Fees (7 days average) = x21;
The discrepancy with regard to TVL between both protocols is partially explained by accounting for the rate of utilization (based on 7 days average). It’s important to also consider that mStable’s swapping fees are fully distributed to Save depositors. Curve’s fees, on the other hand, are distributed to its liquidity providers and to its holders who have vote-locked their CRV (veCRV). Given that only 50% of the fees go to veCRV holders, Curve’s revenue to CRV holders is equivalent to half of its earned fees.
(source: Dune Analytics)
Given that mStable doesn’t distribute earnings to MTA holders, its Price-to-Sales ratio should be equal to infinity. However, in order to compare it with Curve, the assumption of potential revenue is made using mStable’s cumulative earned fees.
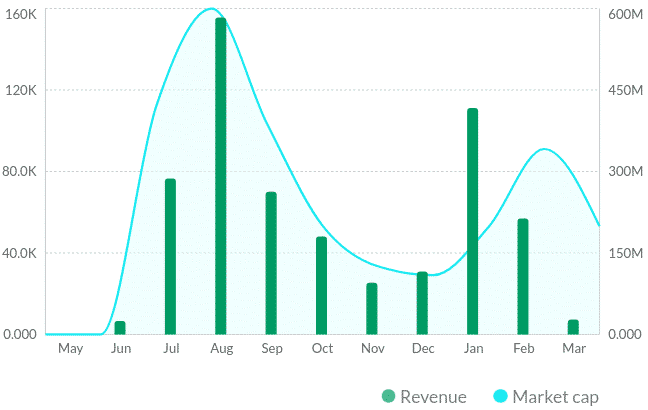
(source: Token Terminal)
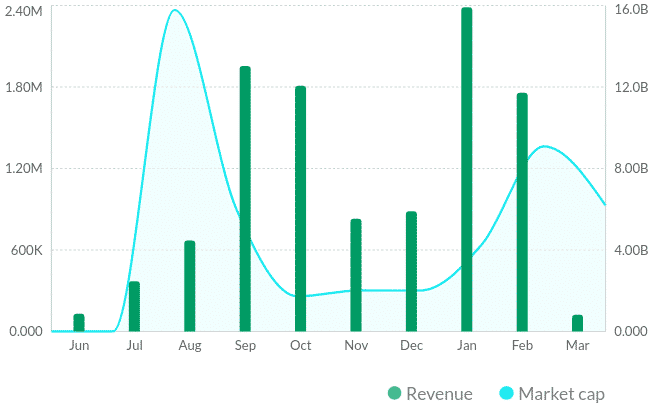
(source: Token Terminal)
| Protocol | Cumulative Revenue | Price-to-Sales |
| mStable | $600K | 287x |
| Curve | $12M | 320x |
(source: Dune Analytics)
Fees and Slippage
Besides the available liquidity within a pool, fees and slippage are also important metrics while evaluating the competitiveness of AMM-based decentralized exchanges.
| Metric | Curve | mStable | Saddle | Swerve |
| Fees | 0.04% | 0.06% | 0.04% | 0.03% |
(source: Curve, mStable, Saddle, Swerve)
Swerve stands as the protocol with the lowest trading fees. Nonetheless, given its low liquidity, there’s a higher slippage associated with it when compared to highly liquid pools such as Curve. In this context, mStable’s differentiating factor consists of its zero-slippage swaps. For low volume trades, it is important to point out that Curve has significantly higher transaction fees (approximately 4x higher due to its computational complexity) than mStable.
Depositor’s APY’s
High APYs represent an important incentive to bootstrap liquidity and increase the protocol’s TVL. These high APYs can be achieved through inflationary incentives and other tokenomics. As porotcols evolve, these APYs tend to decrease and become less volatile.
| Metrics | Curve | mStable | Swerve | Saddle |
| Base APY | 1.94% | 20.02% | 0.29% | 0.8% |
| Rewards APY | +12.70% CRV | +5.33% MTA | +26.59% SWRV | +8.87% KEEP |
(source: Curve, mStable, Saddle, Swerve)
The APY considered for Curve corresponds to its pool with the highest volume (3pool). Nonetheless, Curve’s highest base APY is equal to 18.48% in a low volume pool. It’s important to bear in mind that mStable’s APY is composed of other external factors besides swapping fees. Its ”Rewards APY” was extrapolated from Save’s vault. Lastly, the ”Rewards APY” that was considered didn’t take into consideration the ”boost” incentive that’s gained by locking governance tokens.
mStable versus DeFiDollar
DeFiDollar is a protocol that allows the diversification of stablecoins through its native meta stablecoin (DUSD) that’s collateralized by Curve Finance LP tokens.
Compared to mStable, DeFiDollar has five main functions within its protocol:
• Mint and Redeem;
• Savings;
• Staking;
• LP rewards;
Due to the structural and functional similarities that exist between mStable and DeFiDollar, both will be simultaneously compared and analyzed.
Savings
DeFiDollar uses Curve for its integration with lending protocols and token swaps. By doing so, it creates protocol rewards that accumulate in its DUSD LP capital, generating its Savings APY.
The rewards are generated through:
• Yield from lending protocols;
• Trading fees from Curve’s pools;
• Redeem fees from DUSD (0.1%);
• Redemption fees from Saving’s deposits (0.5%);
| Metric | mStable | DeFiDollar |
| APY (7 days avg.) | 20.2% | 24.8% |
(source: mStable, DeFiDollar)
Currently, the APYs from mStable’s Save and DeFiDollar’s Savings are similar. However, it is important to bear in mind that these APYs can be very volatile.
Another important distinction is that, unlike mStable’s Save, the DUSD deposited in DeFiDollar’s Savings is used as collateral for its insurance mechanism that guarantees DUSD’s re-collateralization in case of a broken peg. This mechanism has recently been deprecated and DeFiDollar is developing a multi-tiered safety module that will use its governance token (DFD) as the backstop of last resort.
Yield Farming
DeFiDollar and mStable both distribute their governance tokens as yield rewards in incentivized liquidity pools such as Balancer, Curve, and Uniswap.
| Metrics | mStable | DeFiDollar |
| Base APY | 0.94% | 0.69% |
| Rewards APY | +14.03% MTA +9.2% CRV | +24.49% DFD +8.75% CRV |
| Daily Volume | $207.4K | $67K |
(source: Curve.finance)
| Metric | mStable | DeFiDollar |
| Rewards APY | +66.13% MTA | +43% DFD |
(source: mStable, DeFiDollar)
| Metric | mStable | DeFiDollar |
| Rewards APY | +35.21% MTA | +132% DFD |
(source: mStable, DeFiDollar)
These rewards are used to bootstrap liquidity and they’re supported through token inflation, therefore, extremely high yields pose a crippling effect on the underlying protocol tokenomics. This initially high inflation in both mStable and DeFiDollar will progressively be reduced over time as liquidity builds up in each protocol.
Staking
This function allows the protocol users to stake their DFD governance tokens in order to receive a share of the protocol income and inflation rewards through interest-bearing DFD (ibDFD). Additionally, the staked DFD will act in the future as an insurance layer for DUSD.
| Metric | mStable | DeFiDollar |
| Staking APY | 2.38% – 33.74% | 65.9% |
(source: mStable, DeFiDollar)
mStable’s MTA staking APY is dependent on the chosen stake lockup period. The given interval corresponds to the APY achieved with the minimum and maximum lockup.
mUSD versus DUSD
The core of mStable and DeFiDollar lies in their diversified pegged crypto assets, therefore, to evaluate the adoption scale of both protocols it is necessary to compare their native meta assets. Considering that as of now DeFiDollar has only one pegged asset (DUSD), mBTC will be neglected in this analysis.
| Metrics | mUSD | DUSD |
| Circulating Supply | $47.5M | $14.1M |
| 24h Volume | $504K | $241K |
| Unique Holders | 4579 | 293 |
(source: Dune Analytics)
Comparing the circulating supply and the number of unique holders of mUSD and DUSD, it is clear that mUSD is the most adopted meta stablecoin.
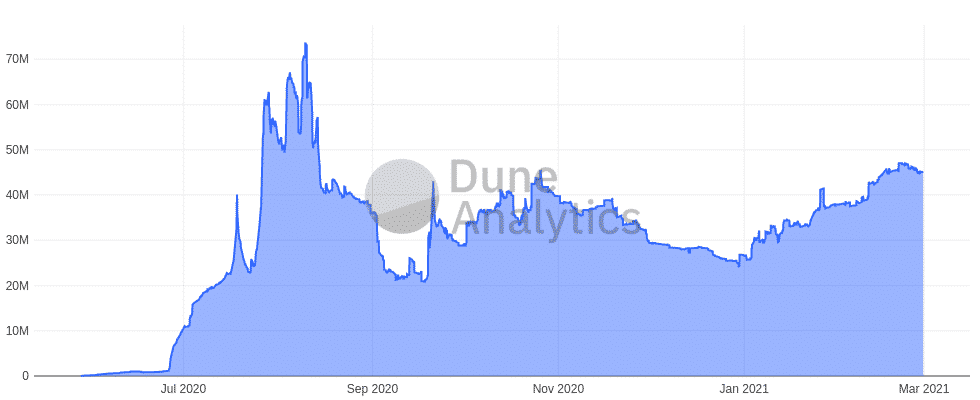
(source: Dune Analytics)
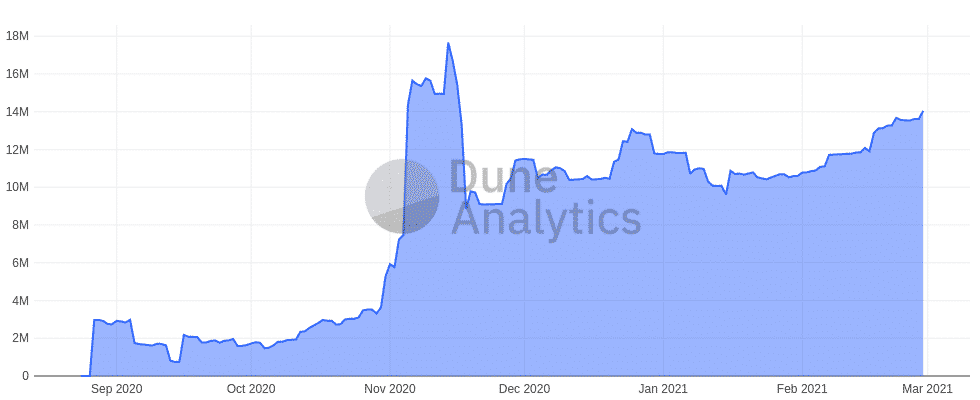
(source: Dune Analytics)
Stablecoins
Currently, there are three main categories of stablecoins: collateralized by FIAT, overcollateralized by multi-asset pools, and algorithmic. Each of these categories has its own advantages and disadvantages, such as centralization, decentralization, different levels of capital efficiency, and stability.
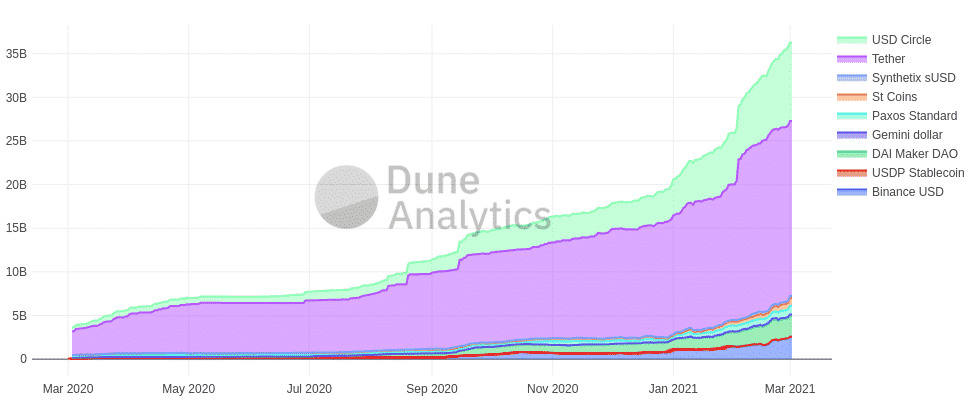
(source: Dune Analytics)
| Metrics | Stablecoins | mUSD |
| Market Capitalization | $54B | $47.5M |
| 24h Volume | $111B | $504K |
(source: CoinGecko)
With the inherent risks that each category has associated, a meta stablecoin such as mUSD offers a value proposition based on its risk diversification. Furthermore, given that it’s possible to add and remove stablecoins from its baskets, mUSD is hedged against the different outcomes that might result from the evolution of stablecoins. As of now, mUSD accounts for 0.1% of stablecoin total market capitalization.
Tokenized Bitcoin
Similar to stablecoins – tokenized forms of Bitcoin on Ethereum also experienced rapid growth throughout 2020 through interoperability bridges like Ren protocol. As Bitcoin rises and establishes itself as a store of value, the demand for its tokenized pairs will likely continue to grow due to the utility and usability that they create. Currently, mBTC is still at an initial stage with its TVL capped for security reasons. Once the guarded launch ends it will be possible to compare it with its counterparts.
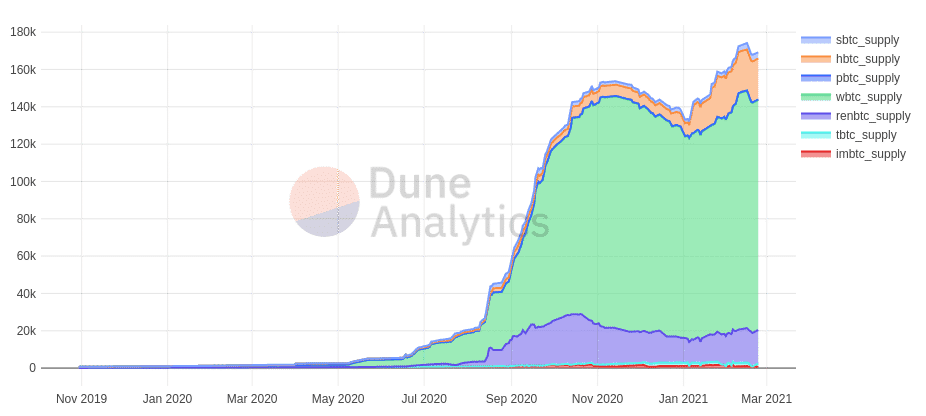
(source: Dune Analytics)
Limitations
• Empty baskets – due to mStable’s hard peg, stablecoins trading at a premium are drained from the basket. This can be seen with sUSD’s basket that’s always empty;
• Limited Swaps – the restricted liquidity caused by drained baskets limits the existing swap opportunities and minimizes potential earned fees;
• bAssets scalability – the limited pairs of bAssets reduces possible swaps between new trading pairs
Future Implementations and Proposals
In order to address the aforementioned limitations that mStable is currently facing, and to improve the platform’s overall functioning, there are several future implementations that are currently being either developed or theorized. It is important to keep in mind that these possible implementations were shared by mStable’s development team through community calls and forum discussions and are subject to change.
As of now, mStable’s team is working on:
• New AMM with feeders for mUSD – this AMM (which is currently live for mBTC) will mitigate issues such as the drained bAsset’s baskets and their limited scalability using Curve’s StableSwap invariant;
• Buy and Make pool – this proposal aims to improve MTA’s tokenomics by creating a new source of demand. This is achieved by diverting part of the platform’s earned fees to this pool;
• Native BTC integration – this feature will leverage REN protocol to create a native integration of BTC in mStable’s platform;
• Cross-asset swaps – mStable’s team is theorizing the feasibility of a Synthetix protocol bridge in order to conduct zero slippage swaps (this has already been accomplished by Curve);
• Re-collateralisation mechanism – this proposal will act as an insurance layer in case of a broken peg from one of the underlying bAssets;
• New mAssets – mETH, mEUR, and mGLD will eventually be added to the protocol;
Conclusion
Through the efficient aggregation of yield created from swapping and lending, mStable is able to create a simple high-yield savings solution while creating meta assets with intrinsic utility that can be used as collateral in DeFi. As new mAssets are added to the protocol and mStable scales, new trading and arbitrage opportunities will likely arise, allowing mStable to increase its earnings and TVL.
Disclosure: This report is not investment advice, it is strictly informational. Do not trade or invest in any tokens, companies, or entities based solely upon this information. Any investment involves substantial risks, including, but not limited to, pricing volatility, inadequate liquidity, and the potential complete loss of principal. Investors should conduct independent due diligence, with assistance from professional financial, legal, and tax experts, on topics discussed in this document and develop a stand-alone judgment of the relevant markets prior to making any investment decision. Albaron Ventures abides by a No Trade Policy for the assets listed in this report for 3 days following its public release. At the time of publication, Albaron Ventures owns MTA and has invested in the imUSD vault.